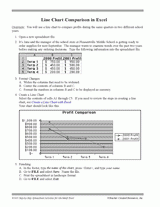
In this computer lesson plan, students use a line chart to compare profits from two different school years. Following the step-by-step instructions, students enter data in a Microsoft Excel® spreadsheet file, create a line chart, and analyze the trends displayed on the graph. The Excel software application is required for these computer activities.


