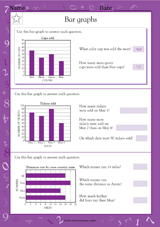
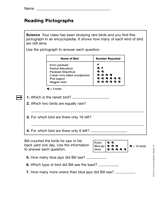
Use these printables and lesson plans to teach students how to read and create various types of graphs and charts. Included are holiday-themed activities, blank graphic organizers, graph paper, game boards, cross-curricular lessons that integrate graphs and charts into reading, social studies, and science classes, and many more activities to keep your students interested and engaged in math class.
Printables for Grades K-2
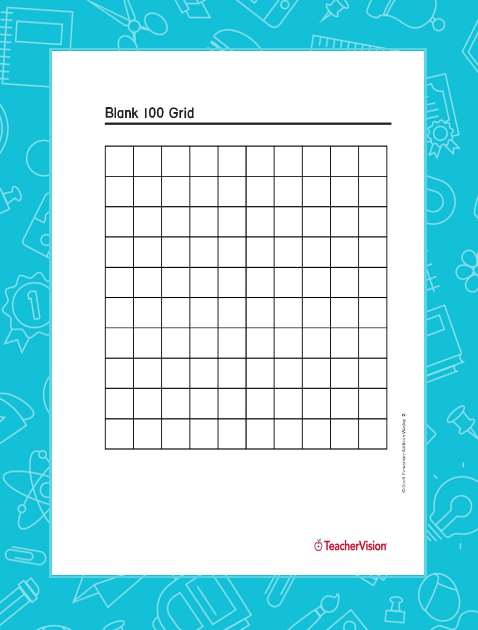
Introduce your students to graphing, word problems and counting with these printables for grades K-2. Printables include a blank 100 grid, sorting activities, matching and grouping activities, and much more!- Blank 100 Grid
- Ways to Show Data
- It's ... Inventory Time!
- Name Your Groups!
- Comparing Data Sets
- The 200 Chart
- The 100 Chart
- More Popular Graphs & Charts Printables, K-2
Printables for Grades 3-5
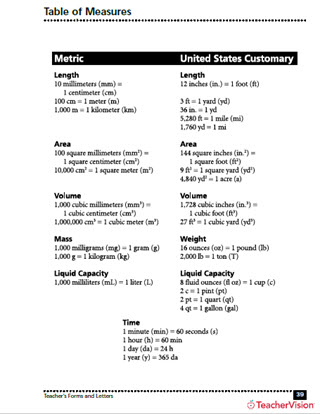
Use our printables for grades 3-5 to help your students understand measurement conversions, correct decimal placement, fractions, the different graphs available, and more!- Table of Measures
- Stringing Along
- More or Less
- Graphing Around
- Slicing the Pie
- Can It Be?
- Make a Circle Graph
- More Popular Graphs & Charts Printables, 3-5
Printables for Grades 6-8
These printables for grades 6-8 include blank graph paper to support your lesson, measurement conversion worksheets, organization charts, worksheets to aid students' decision making skills, and many others!- Table of Measures
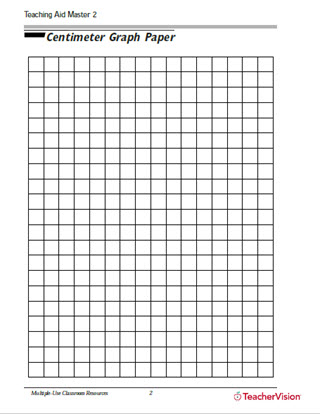
- Centimeter Graph Paper
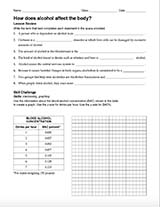
- How Does Alcohol Affect the Body?
- The Middle Ages: Medieval Towns Activity Packet
- Chart, Three-Column
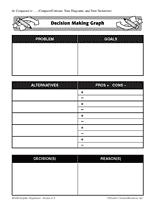
- Charts and Graphs: Decision Making (Gr. 6)
- Career Survey
- More Popular Graphs & Charts Printables, 6-8
Graphic Organizers
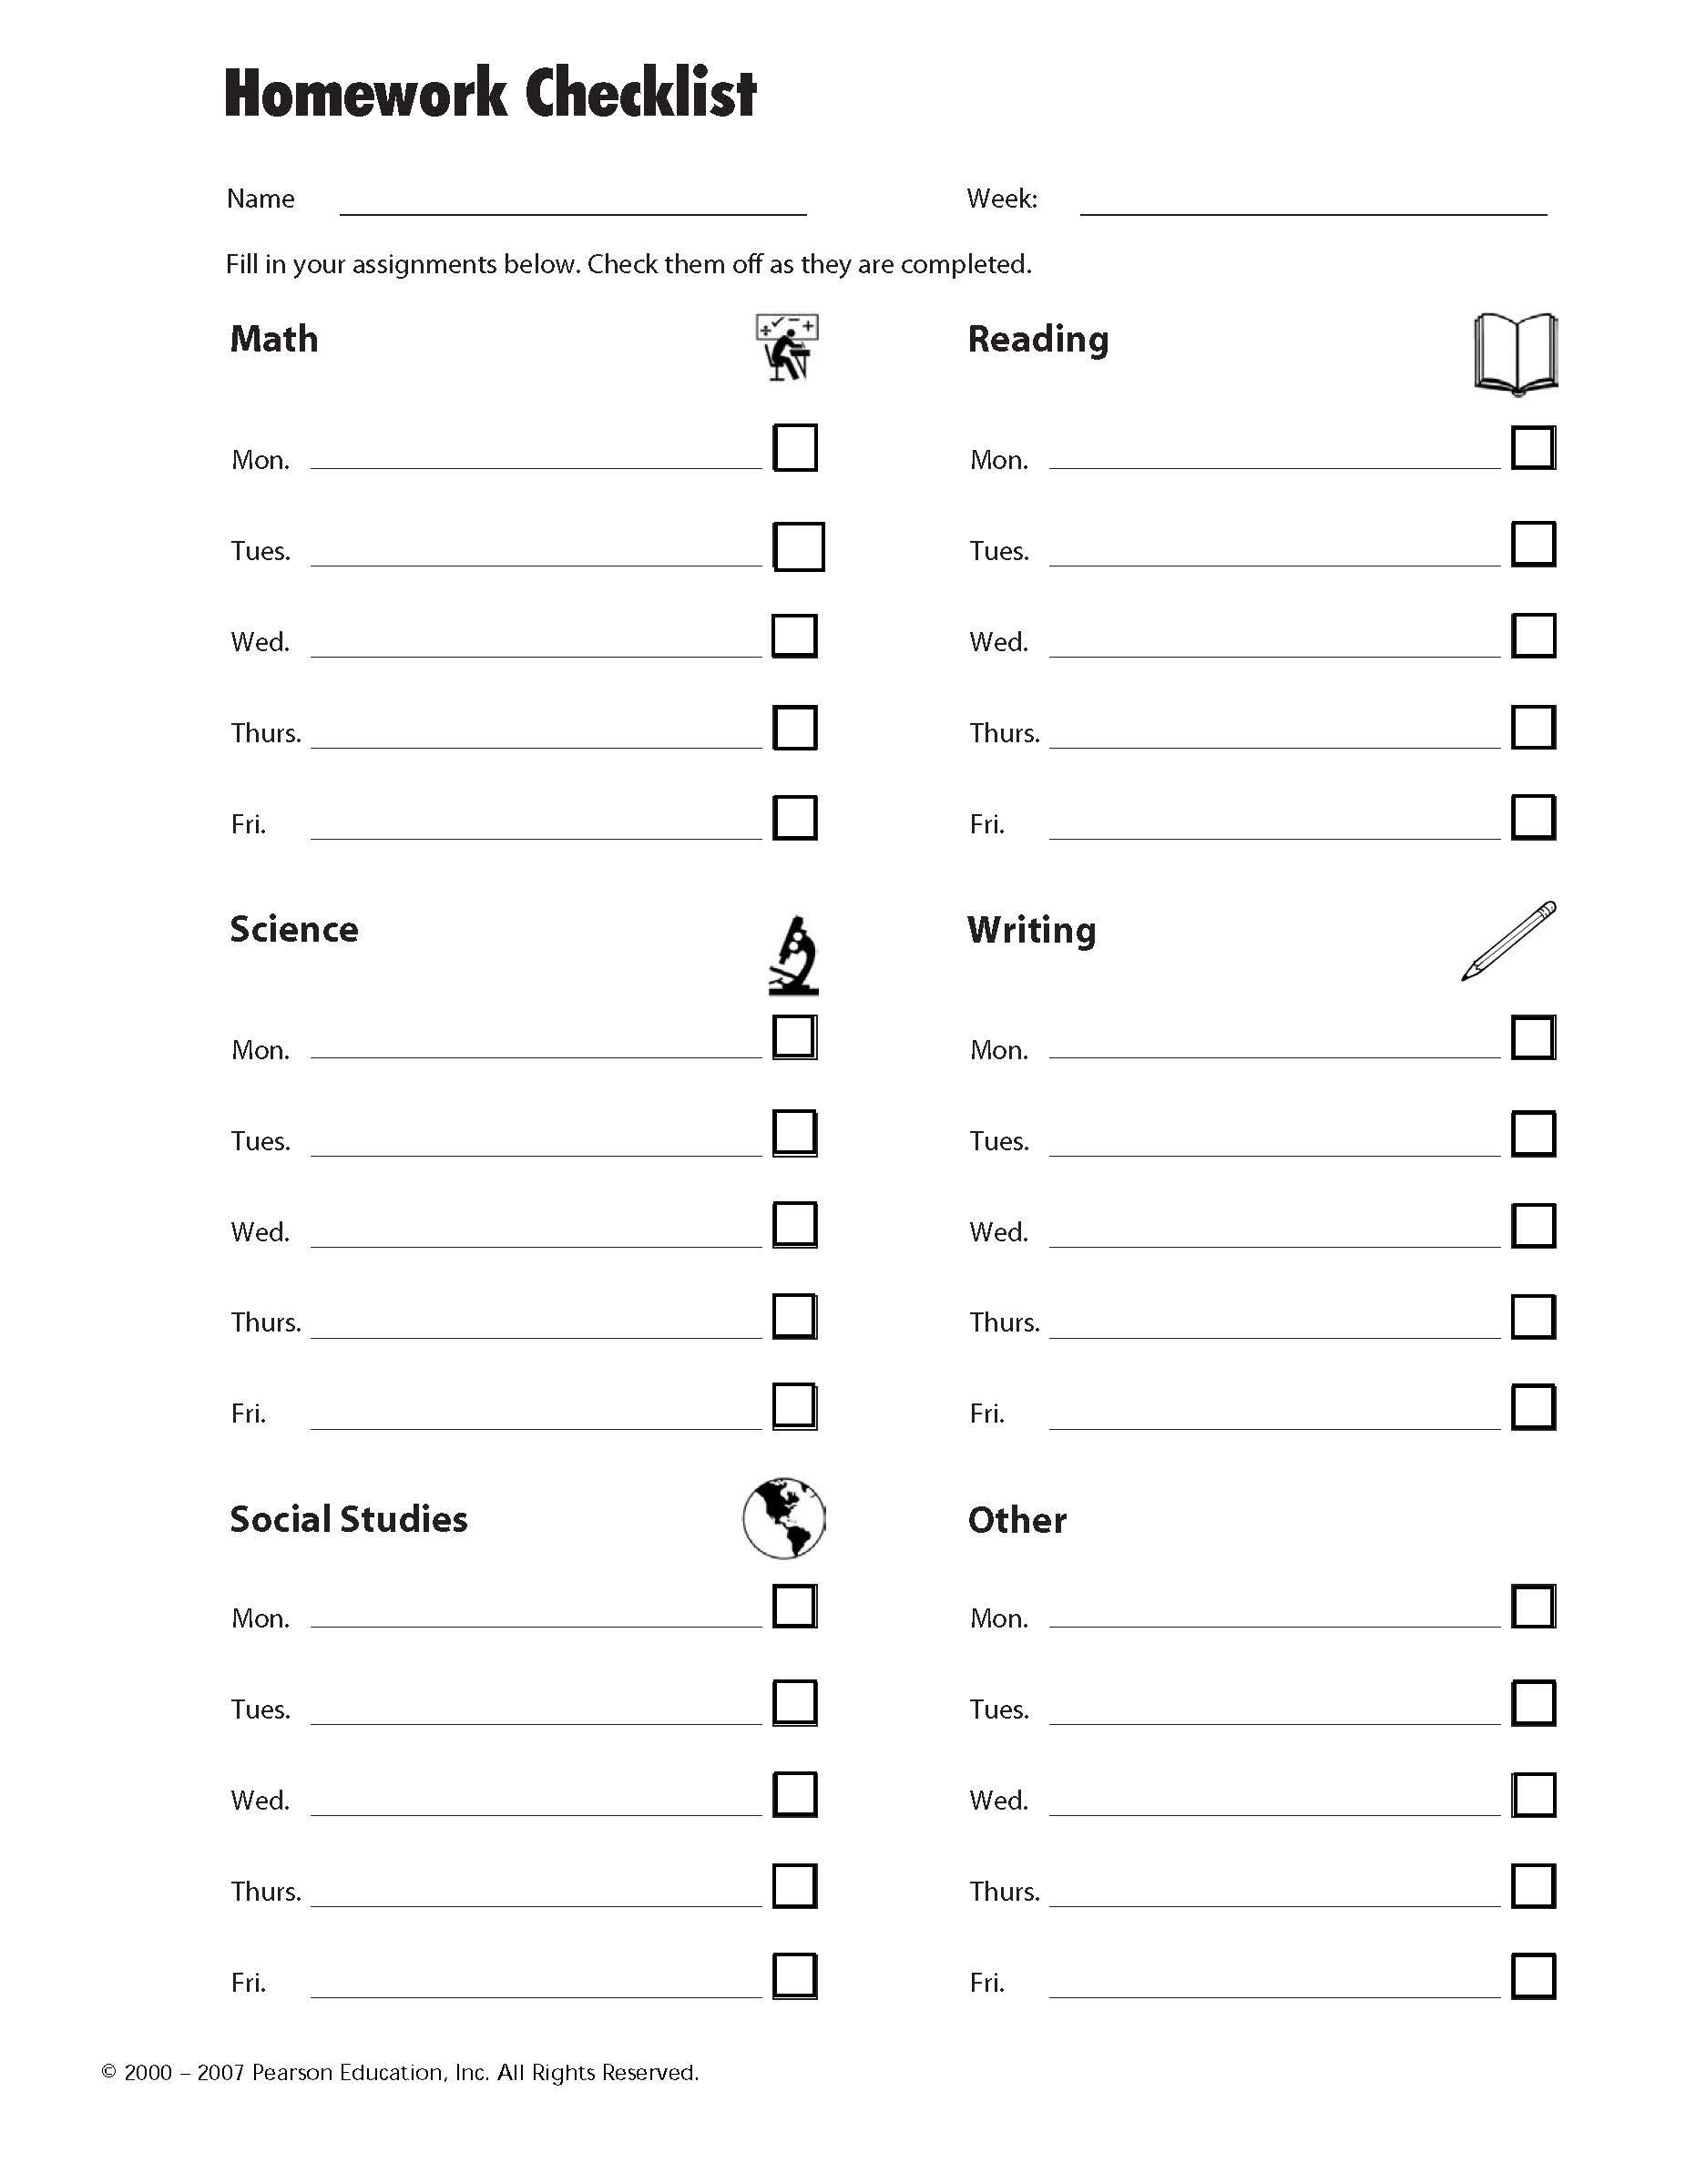
Enhance student organizational skills with these blank homework checklists, pictographs, column charts, KWL charts, graphs and venn diagrams.- Homework Checklist
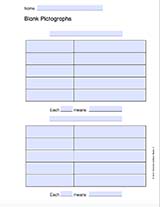
- Blank Pictographs
- Four Column Chart
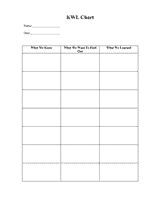
- KWL Chart (Version 3)
- Tally Chart
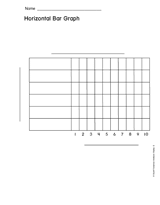
- Horizontal Bar Graph
- Triple Venn Diagram
- More Popular Graphs & Charts Graphic Organizers
Lesson Plans
Follow these lesson plans to help your students understanding how to graph information, the importance of graphs, the different graphs that exist, and much more!- Explaining How to Make a Bar Graph
- Graphing Pitch
- M&M Math
- Bringing the Solar System Down to Earth
- Country of Origin Comparison
- Our Favorite Cookies PowerPoint Presentation
- Star Magnitude Graphing
- More Graphs & Charts Lesson Plans
Holiday Graphs & Charts Activities
Celebrate the holidays with these fun math activities! Activities include graphs, grids, and others all revolving around the holidays.Art & Music Activities
Graphs and charts can be used in more than just math class! Use these timeline and drawing activities to connect graphing to art and music.Reading & Language Arts Activities
Enhance reading and language art skills with these organizational graphs and charts! Plan writing with a graphic organizer, understand the readings with our blank timelines, compare characters with these blank venn diagrams and much more!- Graphic Organizers
- Four Column Chart
- Timeline
- Chart, Two-Column
- Decision Making Chart
- Double Venn Diagram, Version 2
- KWL Charts
- Library Survey
- Author Survey
- What Are Tissues?
- What Is Air?
Science Resources
Graphs and charts are a great way to organize and convey scientific thought. Use our weather graph to teach students weather patterns, our bar graph to help them convey experimental findings, and much more!- Weather Graph
- Creating Circle Graphs
- Baseball Fun
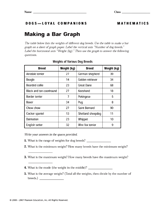
- Making a Bar Graph
- Creating Line Graphs
- Popular Graphing Resources for Science Class
- Relative Humidity: How Much Water Is in the Air?
- More Popular Graphing Resources for Science Class
Social Studies Resources
Use our blank planning pages, bar graphs, and family tree organization chart to help your students employ their graphing skills in social studies class!- Family Tree: Student Planning Page
- Popular Graphing Activities for Social Studies Class
- Bar Graph
- How Large Is Your Family?
- Family Tree Organization Chart with PowerPoint
- Your Family
- Graphing Fun
- More Popular Graphing Resources for Social Studies Class
More Mathematics Resources
Graphs and charts are essential to mathematics! Use our resources to guide your lessons on measurements, addition and subtraction, decimals and fractions, and statistics.- Math Teacher Resources
- Money Resources for Teachers
- Measurement & Time Teacher Resources
- Geometry Teacher Resources
- Addition & Subtraction Teacher Resources
- Decimals, Fractions, & Percentages Teacher Resources
- Estimation, Probability, & Statistics Resources for Teachers
- Algebra Teacher Resources
- Division Resources for Teachers
- Multiplication Resources for Teachers
