WORKSHEETS
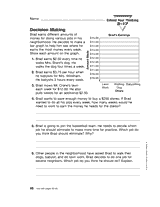
Making a chart of Brad's Job Earnings and analyzing the information is the purpose of this activity.
This collection of word problems asks students to use a menu to find the answers.
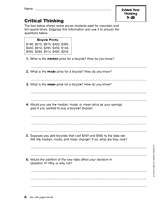
Students are asked to find the mean, median, and mode from a data chart on the cost of bicycles.
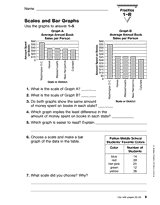
Students determine the scales of various bar graphs in this activity.
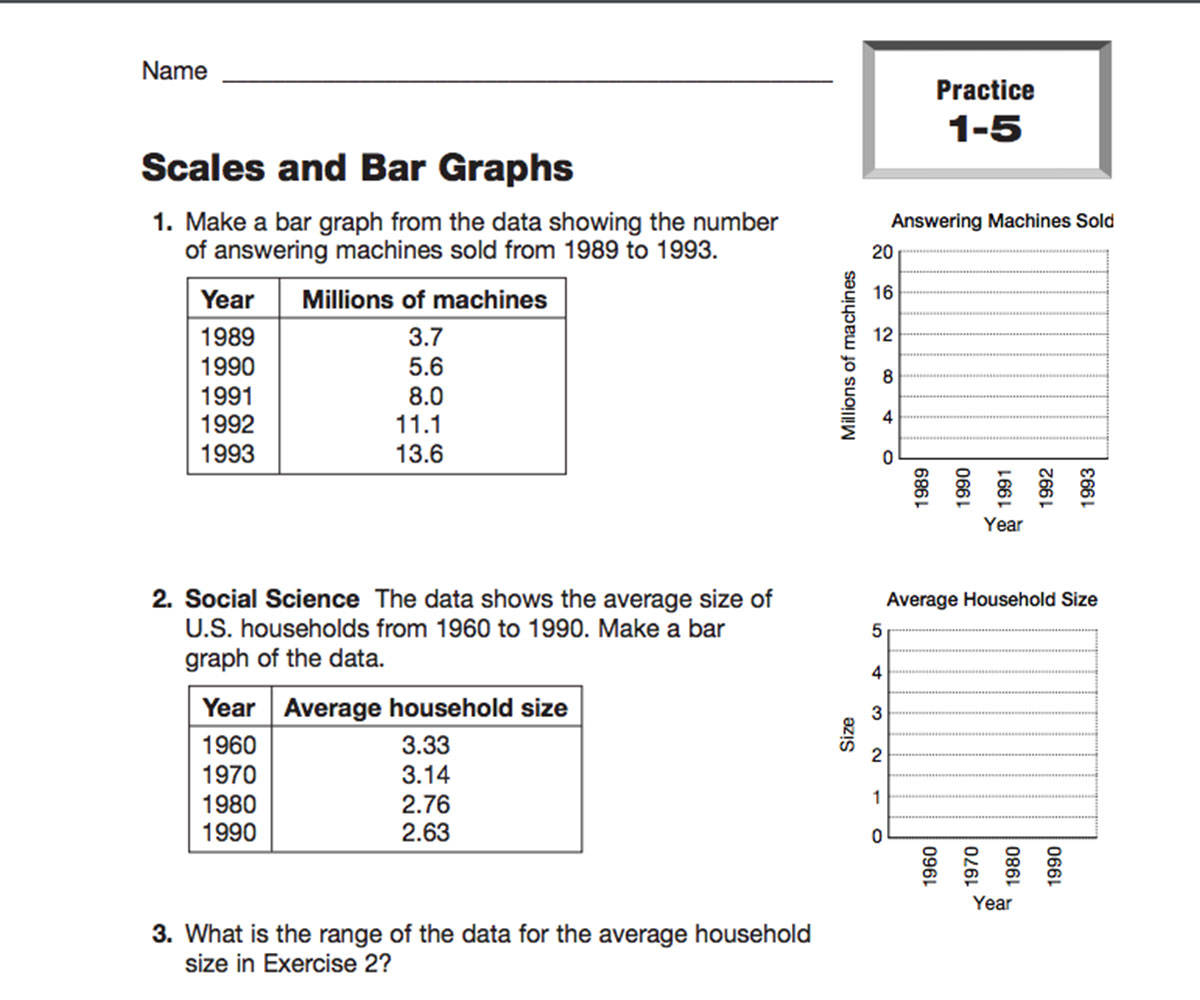
Students use different scales in creating bar graphs from information given.
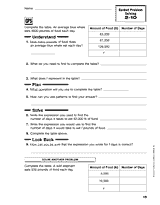
Students determine median and mode from reading a stem and leaf plot and a number line.
Students find the mean from various sets of data given.
CLASSROOM TOOLS
Students practice their problem-solving skills by making a stem-and-leaf diagram from the math data provided. This…
Students answer word problems and fill out a table from information given.
Interpreting and creating pictographs based on census data is explored in this lesson.
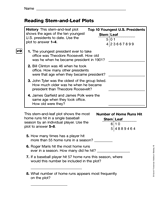
Students use stem-and-leaf plots to solve problems about presidents and baseball.
GRAPHIC ORGANIZERS
Practice using geometric units to determine area with this printable 2-cm isometric grid. Further enhance your math…
Explore the relationship of area and perimeter with this math graphic organizer. This worksheet will help students…
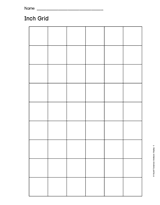
Hand out a printable that shows a grid with one-inch square boxes.
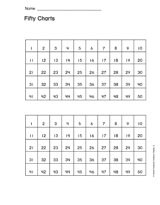
Two printable charts that go up to 50.
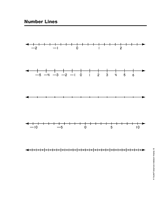
A variety of different number lines that can be used for number explorations.
LESSON PLANS
This spreadsheet activity asks students to collect, organize, and graph data. Students will use formulas to convert…
Students use the Internet to research turkey consumption worldwide. They graph their data with a spreadsheet program,…
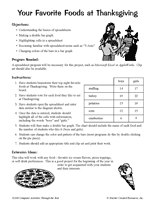
In this printable classroom activity, students brainstorm a list of their favorite foods at Thanksgiving. Then they use…
In this printable computer activity, students learn about formulas on a spreadsheet and use this knowledge to calculate…
Students gather data and construct a graph about their classmates' favorite authors.
Find out which books are most popular in the school by gathering and graphing data.
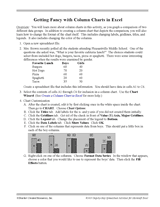
Further students' knowledge of column charts in Microsoft Excel® with this computer lesson plan. Students will make…
In this computer lesson, students will learn how to create a pie chart from survey data in a Microsoft Excel®…