WORKSHEETS
Introduce your students to a lab that tests a student's ability to evaluate the persuasive characteristics of models,…
Students collect and interpret data on how much time they spend indoors and outdoors.
Use this printable math daily warm-up to reinforce your students' skills with graphs, data, and probability.
Talk to your pupils about headaches and migraines, then have them compare the two in this printable Venn diagram…
Students practice addition by filling out six cubes and sentences.
Students practice addition by filling out seven cubes and sentences.
CLASSROOM TOOLS
Print a worksheet that shows a basic facts chart for subtraction.
These colorful fraction bars will enrich your teaching of whole and part relationships. Students can cut out the bars…
This printable has students making a stem-and-leaf graph at home to track the amount of television their families watch.
Explore an activity that has students using a bar graph to track the number of shows on television each night.
Students use coordinate graphing techniques to draw a picture of the Tuatara reptile.
Explore an activity that combines simple arithmetic with graphing techniques to teach students about species populations…
Have students read and interpret the line graph to answer questions about how far and how fast Louis traveled between…
In this first part of this graphing worksheet, students write the coordinates of points on a grid. In the second part,…
This worksheet requires students to read scatterplots and interpret the data.
Using data on a swim team competition will enable students to practice critical thinking skills.
Students use data from a chart to answer questions about grocery costs.
Making a chart of Brad's Job Earnings and analyzing the information is the purpose of this activity.
This collection of word problems asks students to use a menu to find the answers.
Students are asked to find the mean, median, and mode from a data chart on the cost of bicycles.
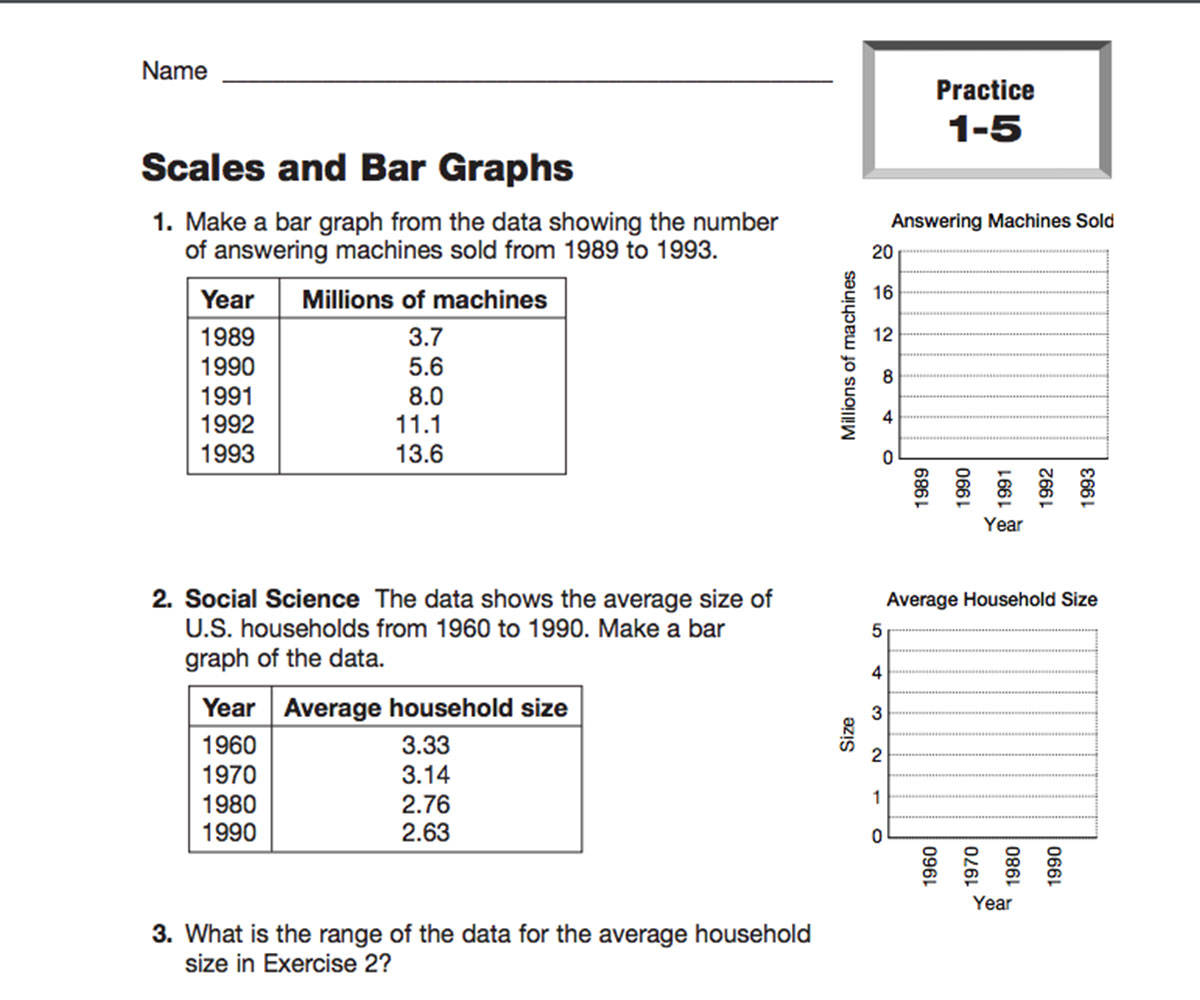
Students determine the scales of various bar graphs in this activity.
Students use different scales in creating bar graphs from information given.
Students determine median and mode from reading a stem and leaf plot and a number line.
Students find the mean from various sets of data given.