Subjects:
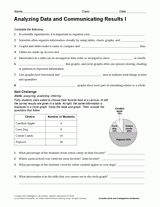
The questions in this printable will help students review how tables, charts, graphs, and diagrams are used to analyze data and communicate results in math and science. The skill-challenge portion of this worksheet asks students to compare information displayed in a table and a graph.
Excerpted from
Concepts and Challenges of Life Science
From Pearson's Concepts and Challenges Life Science.


