WORKSHEETS
Distribute this packet of worksheets to provide a set of charts and data that students use to make decisions.
CLASSROOM TOOLS
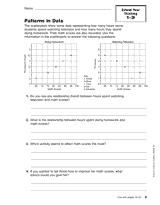
With this packet of worksheets, students practice using data from tables and graphs to answer word problems.
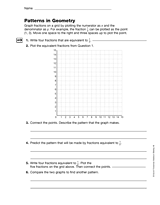
Students graph fractions on a grid by plotting the numerator as x and the denominator as y.
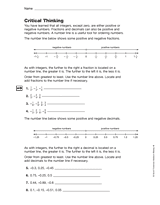
Distribute this packet of worksheets to provide practice in using graphs and number lines to display number…
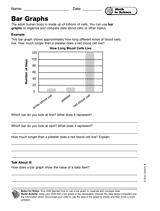
Students use bar graphs to discuss a cell's life span.
Introduce your students to a lab that tests a student's ability to evaluate the persuasive characteristics of models,…
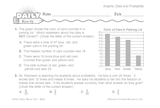
Use this printable math daily warm-up to reinforce your students' skills with graphs, data, and probability.
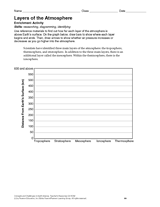
Develop math skills while enriching your Earth science curriculum with this research and graphing activity. Students…
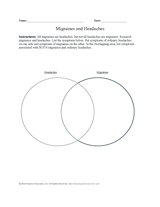
Talk to your pupils about headaches and migraines, then have them compare the two in this printable Venn diagram…
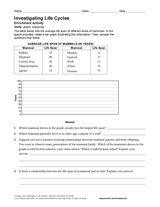
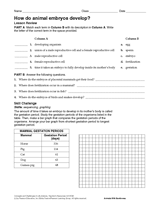
Investigate animal life cycles with this activity. Students will use the information provided in this printable to make…
These colorful fraction bars will enrich your teaching of whole and part relationships. Students can cut out the bars…
Explore an activity that has students using a bar graph to track the number of shows on television each night.
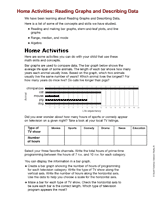
Students practice using statistics and graphs at home by looking for information in the newspaper.
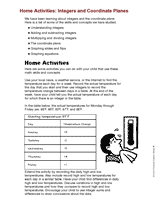
Record the temperature throughout the week so students can review comparing integers.
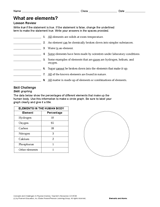
In this physical science printable, students evaluate true/false statements about elements, and create a circle graph…
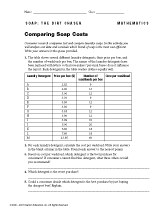
In this printable, children will analyze cost data and determine which brand of soap is the most cost-efficient by…
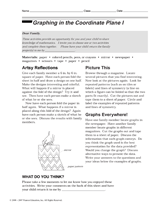
As a check for understanding following your lesson on graphing in coordinate planes, use this math printable to have…
MAPS
This math printable gives students practice with graphs and maps.
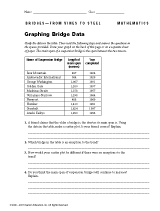
This printable about different bridges will help children practice graphing data from a table. They must also answer the…
After matching terms and answering questions about animal reproduction, students will make a bar graph that compares the…
Learn about our two sets of teeth – deciduous and permanent – by reading the passage in this science…
This worksheet requires students to read scatterplots and interpret the data.
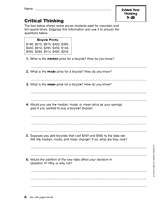
Students are asked to find the mean, median, and mode from a data chart on the cost of bicycles.
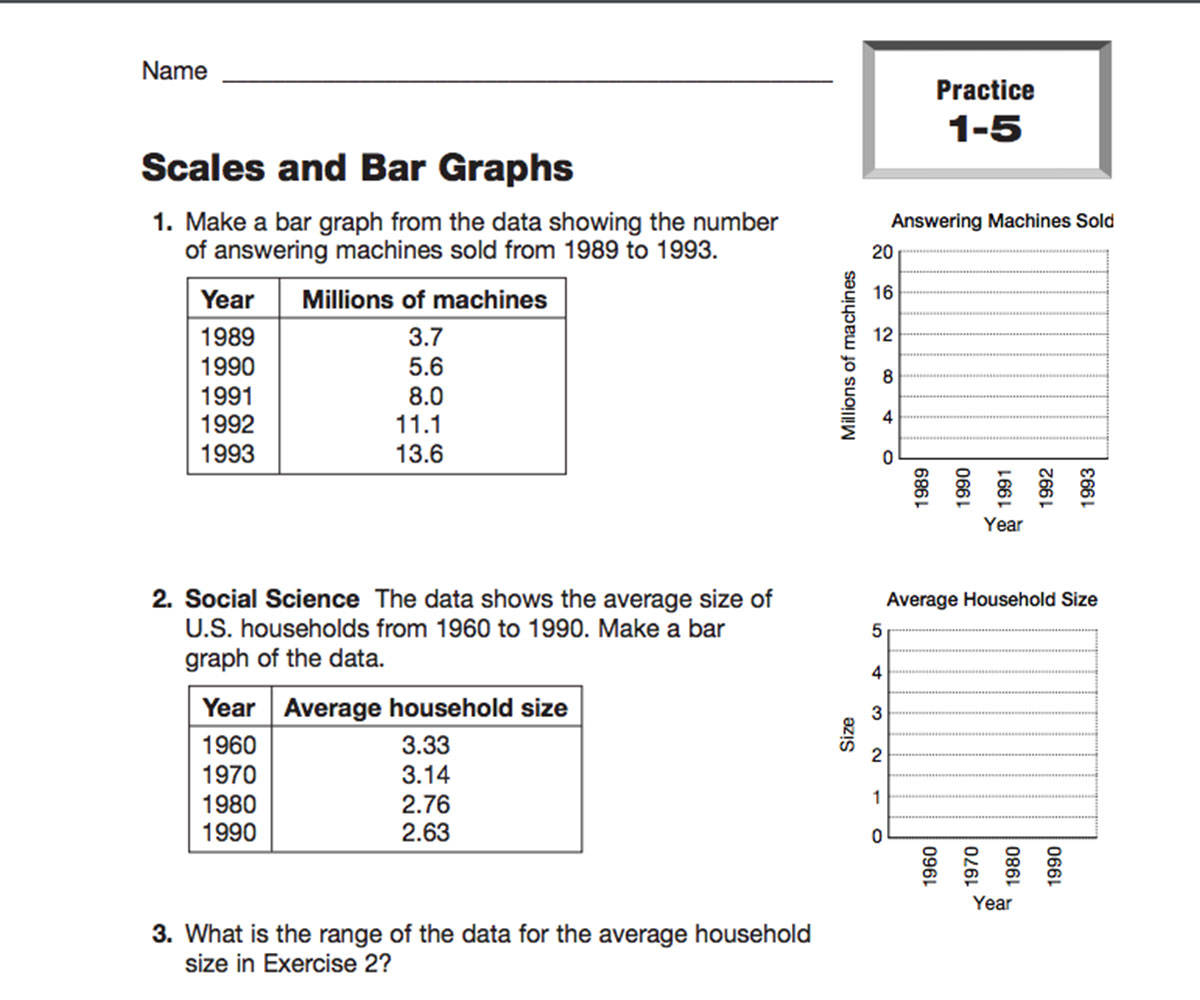
Students use different scales in creating bar graphs from information given.