Subjects:
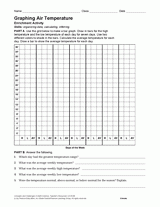
Connect math and science with this graphing activity about air temperature (in Celsius). Students will organize a week of data, calculate average temperature, draw a bar graph, and use the graph to answer questions about weekly highs and lows.
Excerpted from
Concepts and Challenges of Earth Science
From Pearson's Concepts and Challenges Earth Science.


