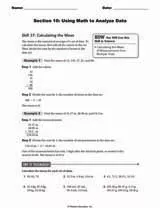
These printables explore how scientists use math to analyze data. This section focuses on calculating the mean as well as defining the mode, median and range. Students are also asked to calculate a percent error.
Featured Middle School Resources
ACTIVITIES
Test Prep Strategies, Tools, and Practice Questions
Help set your students up for academic success with this packet of test-taking tips, test preparation strategies, and pr...
ASSESSMENT
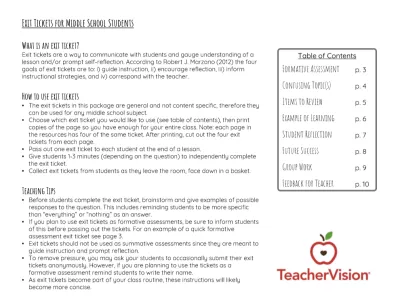
Exit Tickets for Middle School Classrooms
Exit tickets are a form of assessment that are often used informally to assess how well students grasped a lesson, what ...
CHOICE BOARDS
Geography Activities for Middle School
Help students explore the world and develop their geography knowledge with this packet of geography activities for middl...
Related Resources
WORKSHEETS
Analyzing Data and Communicating Results II
Help students review techniques for communicating scientific results with this science printable.
GRAPHIC ORGANIZERS
Analyzing Sources Graphic Organizer
Students can use this graphic organizer to practice paragraphing.
WORKSHEETS
Activity: Using Biomes
Enrich your study of the environment with this science activity.
WORKSHEETS
Activity: Uses of Plants
Enrich your study of plants with a life science printable about their common uses.
WORKSHEETS
Graphing Bridge Data
This printable about different bridges will help children practice graphing data from a table.
WORKSHEETS
Activity: Rocks and Their Uses
This Earth science printable asks students to complete a table with the class, description, and uses for each rock liste...