WORKSHEETS
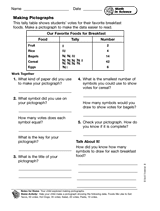
Students discuss problem-solving steps with the goal of learning about pictographs.
Introduce your students to a lab that tests a student's ability to evaluate the persuasive characteristics of models,…
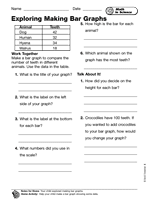
Students discuss problem-solving steps with the learning about bar graphs.
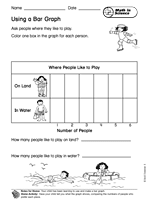
Students learn to use a bar graph by coloring in boxes to correspond to friends' answers.
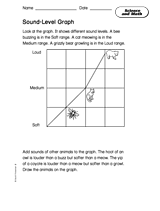
Students plot animal sounds on a volume graph.
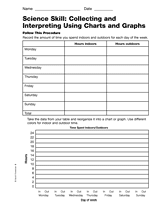
Students collect and interpret data on how much time they spend indoors and outdoors.
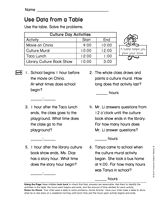
Students use time data from a table to solve schedule questions.
Students explore working with a calendar, reading dates, and finding their birthday.
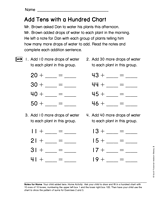
Students practice addition with multiples of ten.
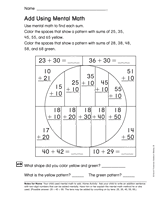
Students use mental math to find each sum.
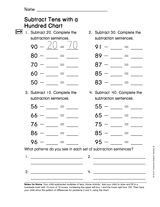
Students practice subtracting by multiples of ten.
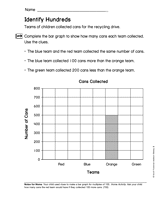
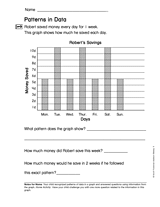
Students must determine answers from clues, then fill in a graph.
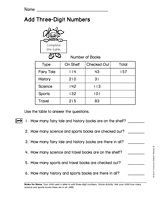
Students practice interpreting three-digit data from a table.
Using one or more of the ideas in this printable, help students understand how to organize information and to expand…
CLASSROOM TOOLS
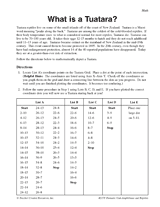
Students use coordinate graphing techniques to draw a picture of the Tuatara reptile.
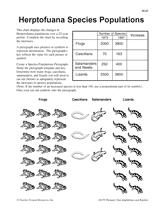
Explore an activity that combines simple arithmetic with graphing techniques to teach students about species populations…
Students use a provided bar graph to answer questions.
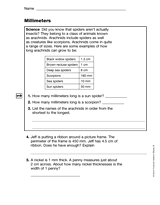
Students use the information in a chart to answer questions.
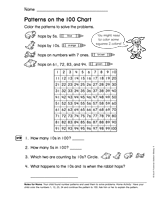
Students color a picture to solve the pattern.
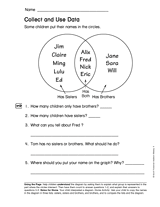
Students are introduced to the concept of a Venn diagram.
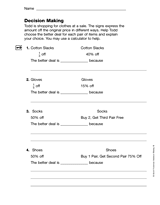
Students employ decision making skills to solve math problems.
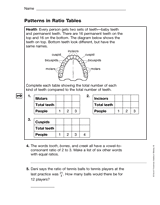
Students identify the ratio pattern, then complete each table.
Distribute this packet of worksheets to provide a set of charts and data that students use to make decisions.
With this packet of worksheets, students practice using data from tables and graphs to answer word problems.