WORKSHEETS
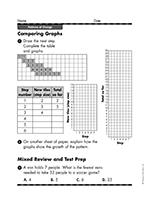
In this worksheet, students are practicing the concept that step size affects the way in which a pattern grows. They are…
ACTIVITIES
Practice graph skills with this popularity graph.
TEACHING RESOURCE
Distribute a chart that depicts the temperature of Whaterville over the course of a week.
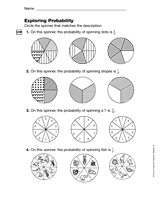
Students answer multiple-choice questions about probability in pie wedges.
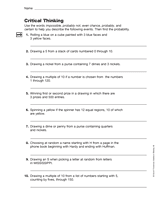
Students review probability skills by completing these two critical thinking worksheets.
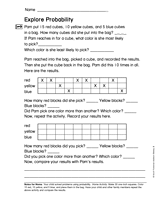
Students explore the concept of probability.
Children will practice their counting and probability skills with this math printable.
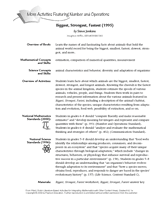
Connect literature, math, and science with activities for Biggest, Strongest, Fastest by Steve Jenkins. Students will…
This math activity concerns probability and its relationship to Pascal's Triangle.
This printable will have students using statistical data to help them draw conclusions and practice graphing.
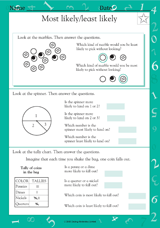
Students use the diagrams and charts to determine which event is most likely or least likely to occur. Use this…
An introduction to probability is featured in this printable math worksheet. Using pictures as a guide, students…
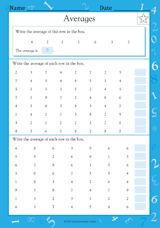
Students find the average of a set of numbers in this statistics worksheet. If necessary, remind them that the average…
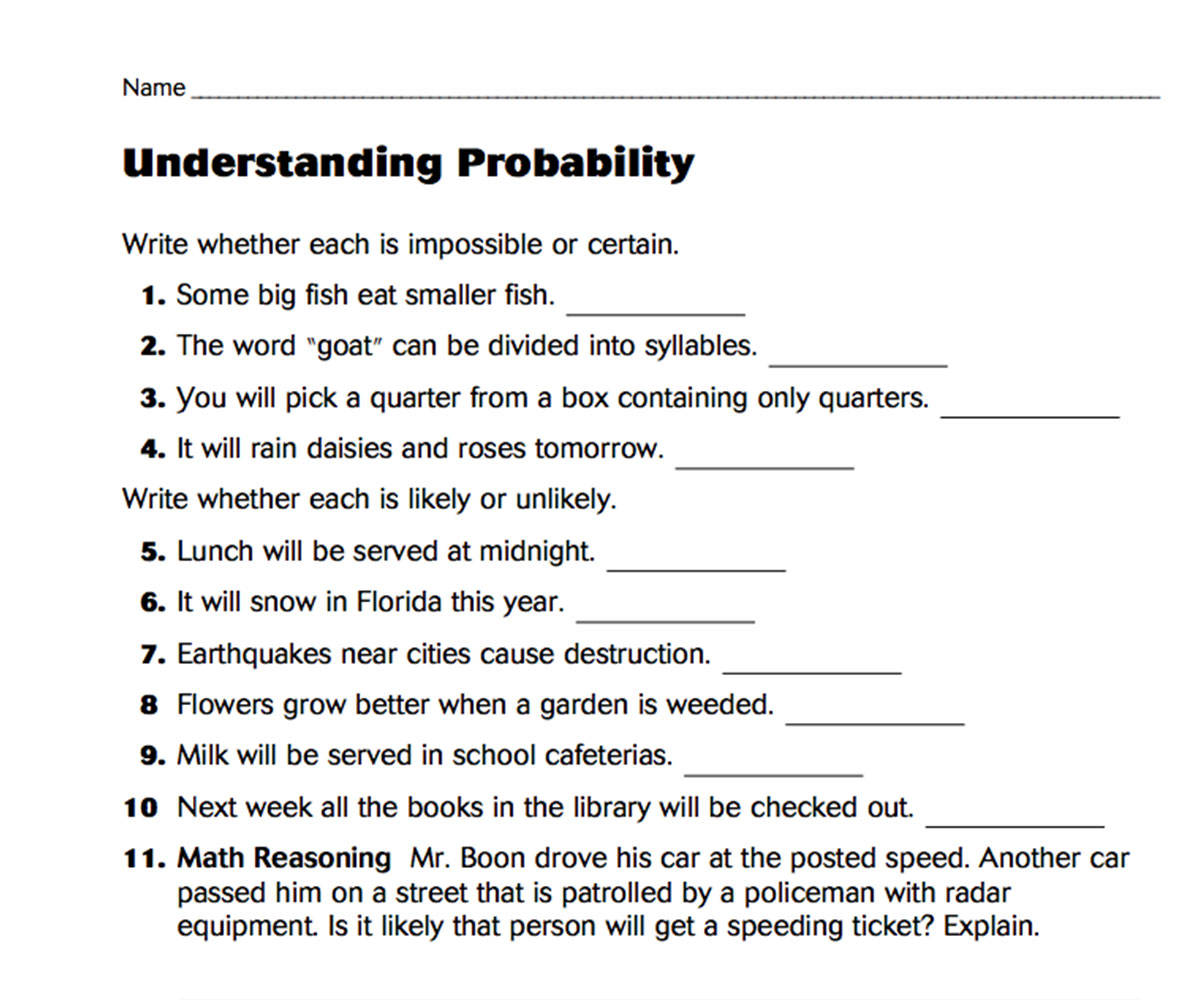
Teach children about what is certain, likely, unlikely, and impossible with this math printable on probability.
DAILY WARM-UPS
Use this printable math daily warm-up to reinforce your students' skills with geometric figures and probability.
LESSON PLANS
This graphs aids students in understanding median, mode and mean.
Answer key.
Answer Key.
CLASSROOM TOOLS
Show students how to create a line graph in Microsoft Excel® using the step-by-step instructions in this lesson…
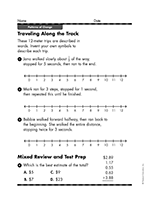
Students are asked to invent symbols to plot on line graphs for trips described in motion stories.
Students are given several statements regarding fair games. They must determine if the statements are true or false,
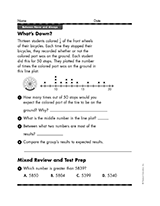
Students are given a line plot and asked questioned based on the trial events.
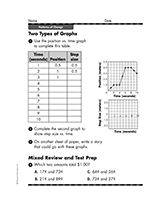
Students are shown a line graph and asked to use the data to make a bar graph.
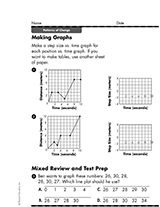
Students are shown a line graph and asked to use the data to complete a table. Next they must use data from the table to…