WORKSHEETS
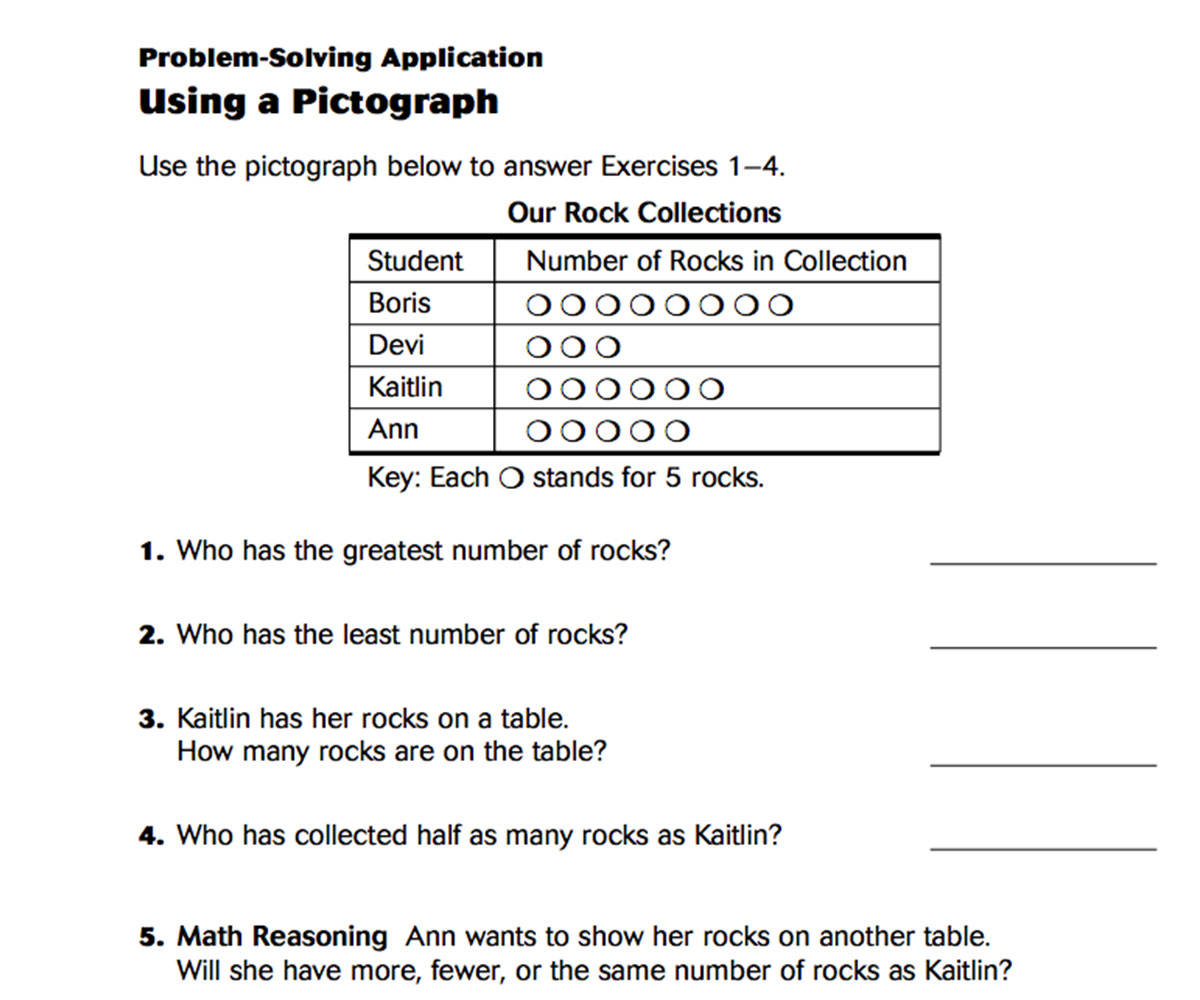
Children will have to use pictographs to answer all of the questions in this math printable.
This family activity letter will help your students practice counting, graphing, and comparing numbers with household…
Give children much-needed practice with reading a line graph, with this helpful math printable.
This worksheet requires students to read scatterplots and interpret the data.
Using data on a swim team competition will enable students to practice critical thinking skills.
Students use data from a chart to answer questions about grocery costs.
Making a chart of Brad's Job Earnings and analyzing the information is the purpose of this activity.
This collection of word problems asks students to use a menu to find the answers.
Students are asked to find the mean, median, and mode from a data chart on the cost of bicycles.
Give this handout to families to help them encourage their child to create graphs at home.
Students make a graph and then answer questions about it.
Students read a bar graph to determine the number of animals found on a class trip.
Students use a data chart to answer an addition word problem.
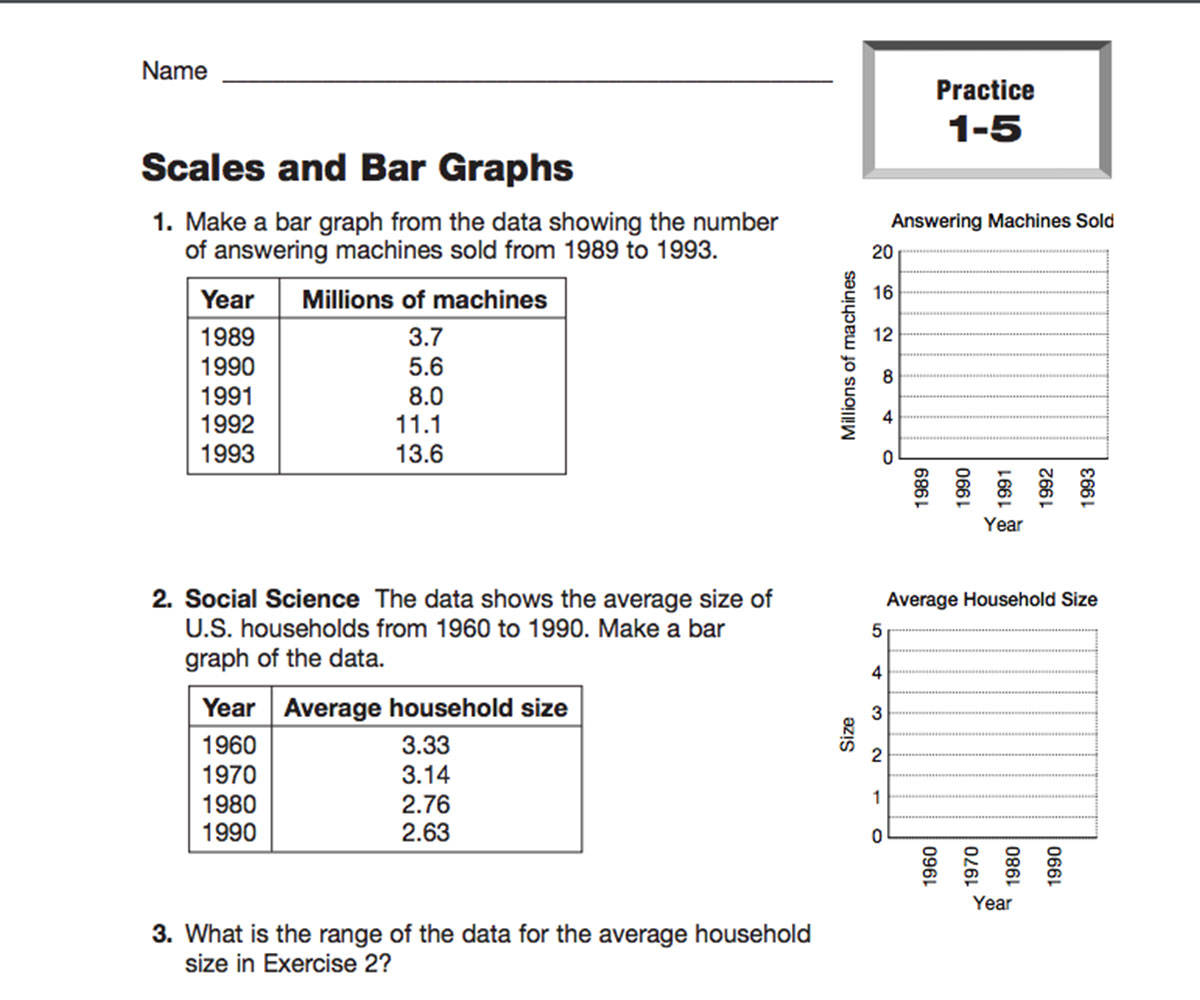
Students determine the scales of various bar graphs in this activity.
Students use different scales in creating bar graphs from information given.
Students determine median and mode from reading a stem and leaf plot and a number line.
Students find the mean from various sets of data given.
CLASSROOM TOOLS
Students practice their problem-solving skills by making a stem-and-leaf diagram from the math data provided. This…
Students answer word problems and fill out a table from information given.
Students practice graph skills by creating a graph after surveying their classmates using this printable resource. Makes…
Students practice collecting data, organizing it into charts, and using the charts to plan an event.
Interpreting and creating pictographs based on census data is explored in this lesson.
Help your students develop their statistical math skills by exploring range, median, and mode using data from the…
Conduct a class survey about students' favorite cookies. This handy tally chart makes it easy for students to keep track…