WORKSHEETS
Use this printable to have children complete a bar graph and answer questions about mountain heights.
CLASSROOM TOOLS
Another version of a Venn Diagram! This printable is customizable. Tailor the PDF to your teaching needs by typing in…
LESSON PLANS
Students collect data from coin tosses and chart this information on a spreadsheet. Then, they create a graph and…
Challenge students to identify, characterize, and graph gases in Earth's air. In this science printable, students will…
In this printable, students will practice math with different types of graphs and integers.
This printable will have students using statistical data to help them draw conclusions and practice graphing.
In this printable, students are asked to practice math with percentages and make their own circle graphs.
Students learn how to graph points by using a function table.
By creating a paper snowflake students will learn how and why the perimeter is infinite. This is a fun math activity for…
Hand out a printable computer activity that teaches the basics of a spreadsheet. Students research how fast different…
Show students how to create a line graph in Microsoft Excel® using the step-by-step instructions in this lesson…
Students will learn about the bicycle and how the gears work. Once they have finished the research part of the activity,…
Develop math skills while enriching your Earth science curriculum with this research and graphing activity. Students…
Talk to your pupils about headaches and migraines, then have them compare the two in this printable Venn diagram…
Investigate animal life cycles with this activity. Students will use the information provided in this printable to make…
Distribute this printable worksheet that aids students in learning about median, mode and mean by answering these word…
Use a chart to compare and contrast data on your baby teeth and your permanent teeth.
Students learn when to use a bar graph and are given tips for constructing bar graphs. They consider examples and decide…
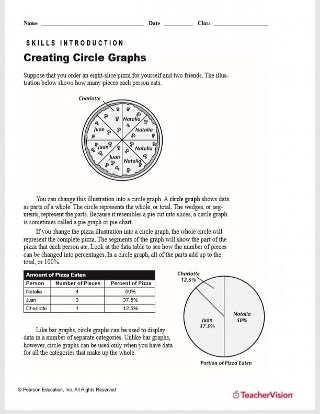
Use this math printable resource to help students learn when to use and how to construct circle graphs. They answer…
In this printable, children will analyze cost data and determine which brand of soap is the most cost-efficient by…
As a check for understanding following your lesson on graphing in coordinate planes, use this math printable to have…
MAPS
This math printable gives students practice with graphs and maps.
This printable about different bridges will help children practice graphing data from a table. They must also answer the…
In this physical science printable, students evaluate true/false statements about elements, and create a circle graph…