REFERENCE
A multiplication chart through 12.
A chart of the prime numbers.
Roman Numerals through 1,000 are presented in a chart.
Statistics concerning school enrollment in the U.S. are presented.
A chart and graphs detailing the numbers and races of high school and college graduates from 1900-1997.
WORKSHEETS
Distribute this printable worksheet that aids students in learning about median, mode and mean by answering these word…
TEACHING RESOURCE
Distribute a chart that depicts the temperature of Whaterville over the course of ten days.
EDITOR'S COLLECTIONS
Students will enjoy these worksheets, which encourage them to use their calculators to demonstrate interesting…
Use a chart to compare and contrast data on your baby teeth and your permanent teeth.
Students learn when to use a bar graph and are given tips for constructing bar graphs. They consider examples and decide…
CLASSROOM TOOLS
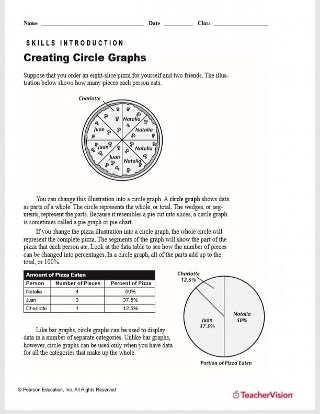
Use this math printable resource to help students learn when to use and how to construct circle graphs. They answer…
In this printable, children will analyze cost data and determine which brand of soap is the most cost-efficient by…
As a check for understanding following your lesson on graphing in coordinate planes, use this math printable to have…
MAPS
This math printable gives students practice with graphs and maps.
This printable about different bridges will help children practice graphing data from a table. They must also answer the…
In this physical science printable, students evaluate true/false statements about elements, and create a circle graph…
After matching terms and answering questions about animal reproduction, students will make a bar graph that compares the…
Learn about our two sets of teeth – deciduous and permanent – by reading the passage in this science…
Use this printable to help children make and analyze bar graphs.
Use equations to create secret messages on a graph. Solving the equation decodes the message.
Your students can use this printable blank template to sequence several dates or events. This graphic organizer is…
Have students create their own line graphs, bar graphs, drawings, and more on this blank graph paper.
LESSON PLANS
This spreadsheet activity asks students to collect, organize, and graph data. Students will use formulas to convert…
Students use the Internet to research turkey consumption worldwide. They graph their data with a spreadsheet program,…