 |
geography
The study of the physical features of the earth. Includes study of regional formations and their relation to humans.
latitude lines
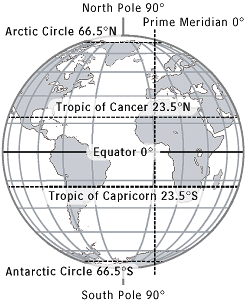
Imaginary lines running horizontally around the globe. Also called parallels, latitude lines are equidistant from each other. Each degree of latitude is about 69 miles (110 km) apart. Zero degrees (0°) latitude is the equator, the widest circumference of the globe. Latitude is measured from 0° to 90° north and 0° to 90° south--90° north is the North Pole and 90° south is the South Pole.
longitude lines
Imaginary lines, also called meridians, running vertically around the globe. Unlike latitude lines, longitude lines are not parallel. Meridians meet at the poles and are widest apart at the equator. Zero degrees longitude (0°) is called the prime meridian. The degrees of longitude run 180° east and 180° west from the prime meridian.
geographic coordinates
Latitude and longitude lines form an imaginary grid over the Earth's surface. By combining longitude and latitude measurements, any location on earth can be determined. The units of measurement for geographic coordinates are degrees (°), minutes ('), and seconds ("). Like a circle, the Earth has 360 degrees. Each degree is divided into 60 minutes, which in turn is divided into 60 seconds. Latitude and longitude coordinates also include cardinal directions: north or south of the equator for latitude, and east or west of the prime meridian for longitude. The geographic coordinates of New York City, for example, are 40° N, 74° W, meaning that it is located 40 degrees north latitude and 74 degrees west longitude. Using minutes and seconds as well as degrees, the coordinates for New York would be 40°42'51" N, 74°0'23" W. (Latitude is always listed first.) A less common format for listing coordinates is in decimal degrees. The Tropic of Cancer, for example, can be expressed in degrees and minutes (23°30' N) or in decimal degrees (23.5° N).
continental drift
Theory that the earth's continents at one time were once part of a singular landmass. It is believed that the continents have spread out due to plate tectonics.
hemisphere
A hemisphere is half the Earth's surface. The four hemispheres are the Northern and Southern hemispheres, divided by the equator (0° latitude), and the Eastern and Western hemispheres, divided by the prime meridian (0° longitude) and the International Date Line (180°).
equator
Zero degrees latitude. The Sun is directly overhead the equator at noon on the two equinoxes (March and Sept. 20 or 21). The equator divides the globe into the Northern and Southern hemispheres. The equator appears halfway between the North and South poles, at the widest circumference of the globe. It is 24,901.55 miles (40,075.16 km) long.
prime meridian
Zero degrees longitude (0°). The prime meridian runs through the Royal Greenwich Observatory in Greenwich, England (the location was established in 1884 by international agreement). The prime meridian divides the globe into the Western and Eastern hemispheres. The Earth's time zones are measured from the prime meridian. The time at 0° is called Universal Time (UT) or Greenwich Mean Time (GMT). With the Greenwich meridian as the starting point, each 15° east and west marks a new time zone. The 24 time zones extend east and west around the globe for 180° to the International Date Line. When it is noon along the prime meridian, it is midnight along the International Date Line.
International Date Line
Located at 180° longitude (180° E and 180° W are the same meridian). Regions to the east of the International Date Line are counted as being one calendar day earlier than the regions to the west. Although the International Date Line generally follows the 180° meridian (most of which lies in the Pacific Ocean), it does diverge in places. Since 180° runs through several countries, it would divide those countries not simply into two different time zones, but into two different calendar days. To avoid such unnecessary confusion, the date line dips and bends around countries to permit them to share the same time.
tropics
Also referred to as the torrid zone or tropical zone, all the water and land of the earth between the Tropic of Cancer and the Tropic of Capricorn. The tropics experience at least one day per year in which the sun passes directly overhead.
Tropic of Cancer
A line of latitude located at 23°30' north of the equator. The Sun is directly overhead the Tropic of Cancer on the summer solstice in the Northern Hemisphere (June 20 or 21). It marks the northernmost point of the tropics, which falls between the Tropic of Cancer and the Tropic of Capricorn.
Tropic of Capricorn
A line of latitude located at 23°30' south. The Sun is directly overhead the Tropic of Capricorn on the summer solstice in the Southern Hemisphere (Dec. 20 or 21). It marks the southernmost point of the tropics.
Arctic Circle
A line of latitude located at 66°30' north, delineating the Northern Frigid Zone of the Earth.
Antarctic Circle
A line of latitude located at 66°30' south, delineating the Southern Frigid Zone of the Earth.
globe
The most accurate map of the Earth, duplicating its spherical shape and relative size.
pole
Point at which the earth turns; the north and south poles illustrate the axis on which the earth rotates.
map
Representation of a physical plane with selective information. Maps represent a definite area and contain detailed geographical information.
atlas
Combination of maps and charts. An atlas usually includes geographical information, as well as varied non-geographical information (population statistics, sea levels, etc.) about a particular location.
compass
A directional device that is made of a magnetic needle that synchronizes with the north and south poles.
climate maps
Give general information about the climate and precipitation (rain and snow) of a region. Cartographers, or mapmakers, use colors to show different climate or precipitation zones.
economic or resource maps
Feature the type of natural resources or economic activity that dominates an area. Cartographers use symbols to show the locations of natural resources or economic activities. For example, oranges on a map of Florida tell you that oranges are grown there.
physical maps
Illustrate the physical features of an area, such as the mountains, rivers and lakes. The water is usually shown in blue. Colors are used to show relief-differences in land elevations. Green is typically used at lower elevations, and orange or brown indicate higher elevations.
political maps
Do not show physical features. Instead, they indicate state and national boundaries and capital and major cities. A capital city is usually marked with a star within a circle.
road maps
Show major-some minor highways-and roads, airports, railroad tracks, cities and other points of interest in an area. People use road maps to plan trips and for driving directions.
topographic maps
Include contour lines to show the shape and elevation of an area. Lines that are close together indicate steep terrain, and lines that are far apart indicate flat terrain.
map projections
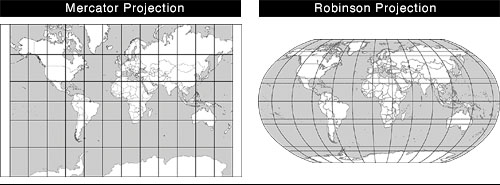
Two-dimensional representations of the three-dimensional Earth. Because projections attempt to present the spherical Earth on a flat plane, they inevitably produce distortions. Map projections are numerous and complex (e.g., there are a variety of cylindrical, conic, or azimuthal projections). Each projection has advantages and serves different purposes, and each produces different types of distortions in direction, distance, shape, and relative size of areas. One of the most famous projections is the Mercator, created by Geradus Mercator in 1569. It is a rectangular-shaped map in which all longitude and latitude lines are parallel and intersect at right angles (on a globe, meridians are not parallel, but grow narrower, eventually converging at the poles). Near the equator, the scale of the Mercator is accurate, but the farther one moves toward the poles, the greater the distortion--Antarctica in the far south and Greenland in the far north, for example, appear gigantic. The Mercator projection was used well into the 20th century, but has now been superseded by others, including the widely used Robinson projection. The Robinson projection is an elliptical-shaped map with a flat top and bottom. Developed in 1963 by Arthur H. Robinson, it is an orthophanic ("right appearing") projection, which attempts to reflect the spherical appearance of the Earth. The meridians, for example, are curved arcs, which gives the flat map a three-dimensional appearance. But to convey the likeness of a curved, three-dimensional globe, the Robinson projection must in fact distort shape, area, scale, and distance. The Albers, Lambert, Mollweide, and Winkel Tripel are some of the other commonly used map projections.
 |


